


Sales reports on maps in the work of a sales director
Sales reports on maps provide a different perspective on sales and help sales managers make better operational and business decisions.
Well… sales reports are neither romantic nor adventurous literature, (although sometimes they can be classified as horror!). It’s hard to spice up sales analytics, even though you can live it up a bit with Business Intelligence systems. As a sales director, you surely know that a story gets more interesting if you add travel threads to it. So how can you get closer to road movies like “The Straight Story” or “Easy Rider”? Use sales reports on maps that help to tell the story of sales and the functioning of your sales representatives in the field.
Avoiding unnecessary descriptions of nature and genre scenes, let’s lay our maps on the table. Let’s reach for the data we store in sales support systems and create a new, better story. Let’s start with the basics.
Sales reports on maps: geographic location of objects and visualization of external reports
Creating a sales strategy in the field should start with looking at the map. Plotting all geographically defined objects on it is the starting point for further decisions. So what should be considered here?
- Sales points (POS/PSD) – this is obvious if our activities are directed to stores. We know that not all points are equal, and professional sales analytics cannot do without segmentation. Therefore, each segment should immediately stand out visually on the map to differentiate retail chains, traditional stores, temporary points, malls, etc.
- Field representatives – usually their location is assumed to be their place of residence, from which they set out on their rounds daily. Sometimes, however, it may be the place of permanent duty, as is the case with stationary promoters or merchandisers.
- Distribution points – if orders are partly fulfilled through distributors, we must control their number and density in our sales territory.
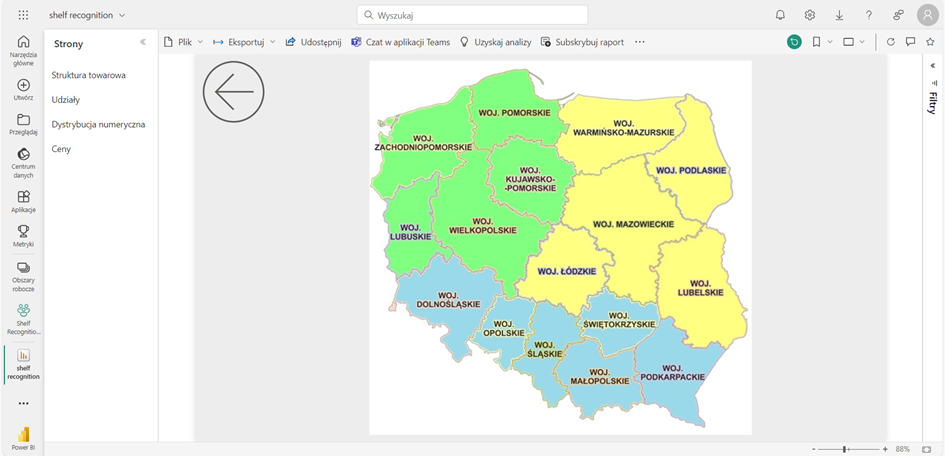
- Geographic divisions – area boundaries do not have to, and certainly should not, coincide forcibly with administrative divisions. However, you should have such layers that consider the distribution of towns with their area, population (preferably with detailed demographic analysis). Other properties valuable for the industry (e.g., agricultural areas, spatial development plans, schools, workplaces, etc.) will also be useful.
- Demographic data – criteria such as age, gender, income, family structure, nationality are extremely important, especially in the consumer goods industry (FMCG, electronics). They will help estimate the sales potential of a territory for visits or store locations.
- Physical data on infrastructure, communication, urbanization, terrain, etc. Sometimes, field obstacles or the location of certain objects can determine the success of sales activities in a given territory.
- Data collected on customer cards – companies in SFA, CRM, ERP systems automatically and manually collect a lot of information. When overlaid on a map, such data creates entirely new landscapes, helping to draw conclusions and inspire new actions.
- Other external data such as from GIS systems – they are extremely important for sales analytics, provoking a new look at the possessed information.
For order’s sake, let’s add that various static layers can be imported into the geographic analytical toolkit. Once generated, they can serve as a background for our data. Examples include seasonality maps, results of commissioned reports, analyses prepared by national statistical offices. Territorial analyses come to life when we present the routes of representatives or reports from geofencing on the above layers.
For convenient and creative work with such data, we recommend Business Intelligence systems and their map-based modules.
But let’s go step by step.
Control of correct assignment in regions
When all objects and entities are correctly plotted on the map, you can perform the first analytical exercise aimed at basic field sales optimization. The map will quickly show whether the stores assigned to a sales representative or distributor form a territory ensuring optimal reach to each point.
Let’s use a simplified example. An even distribution of sales points should generate an area as close to a circle as possible, with the representative’s place of residence (station) in the middle. The same rules apply in shipping, logistics, or distribution. It’s no coincidence that so many logistics centers in Poland are located near Łódź.
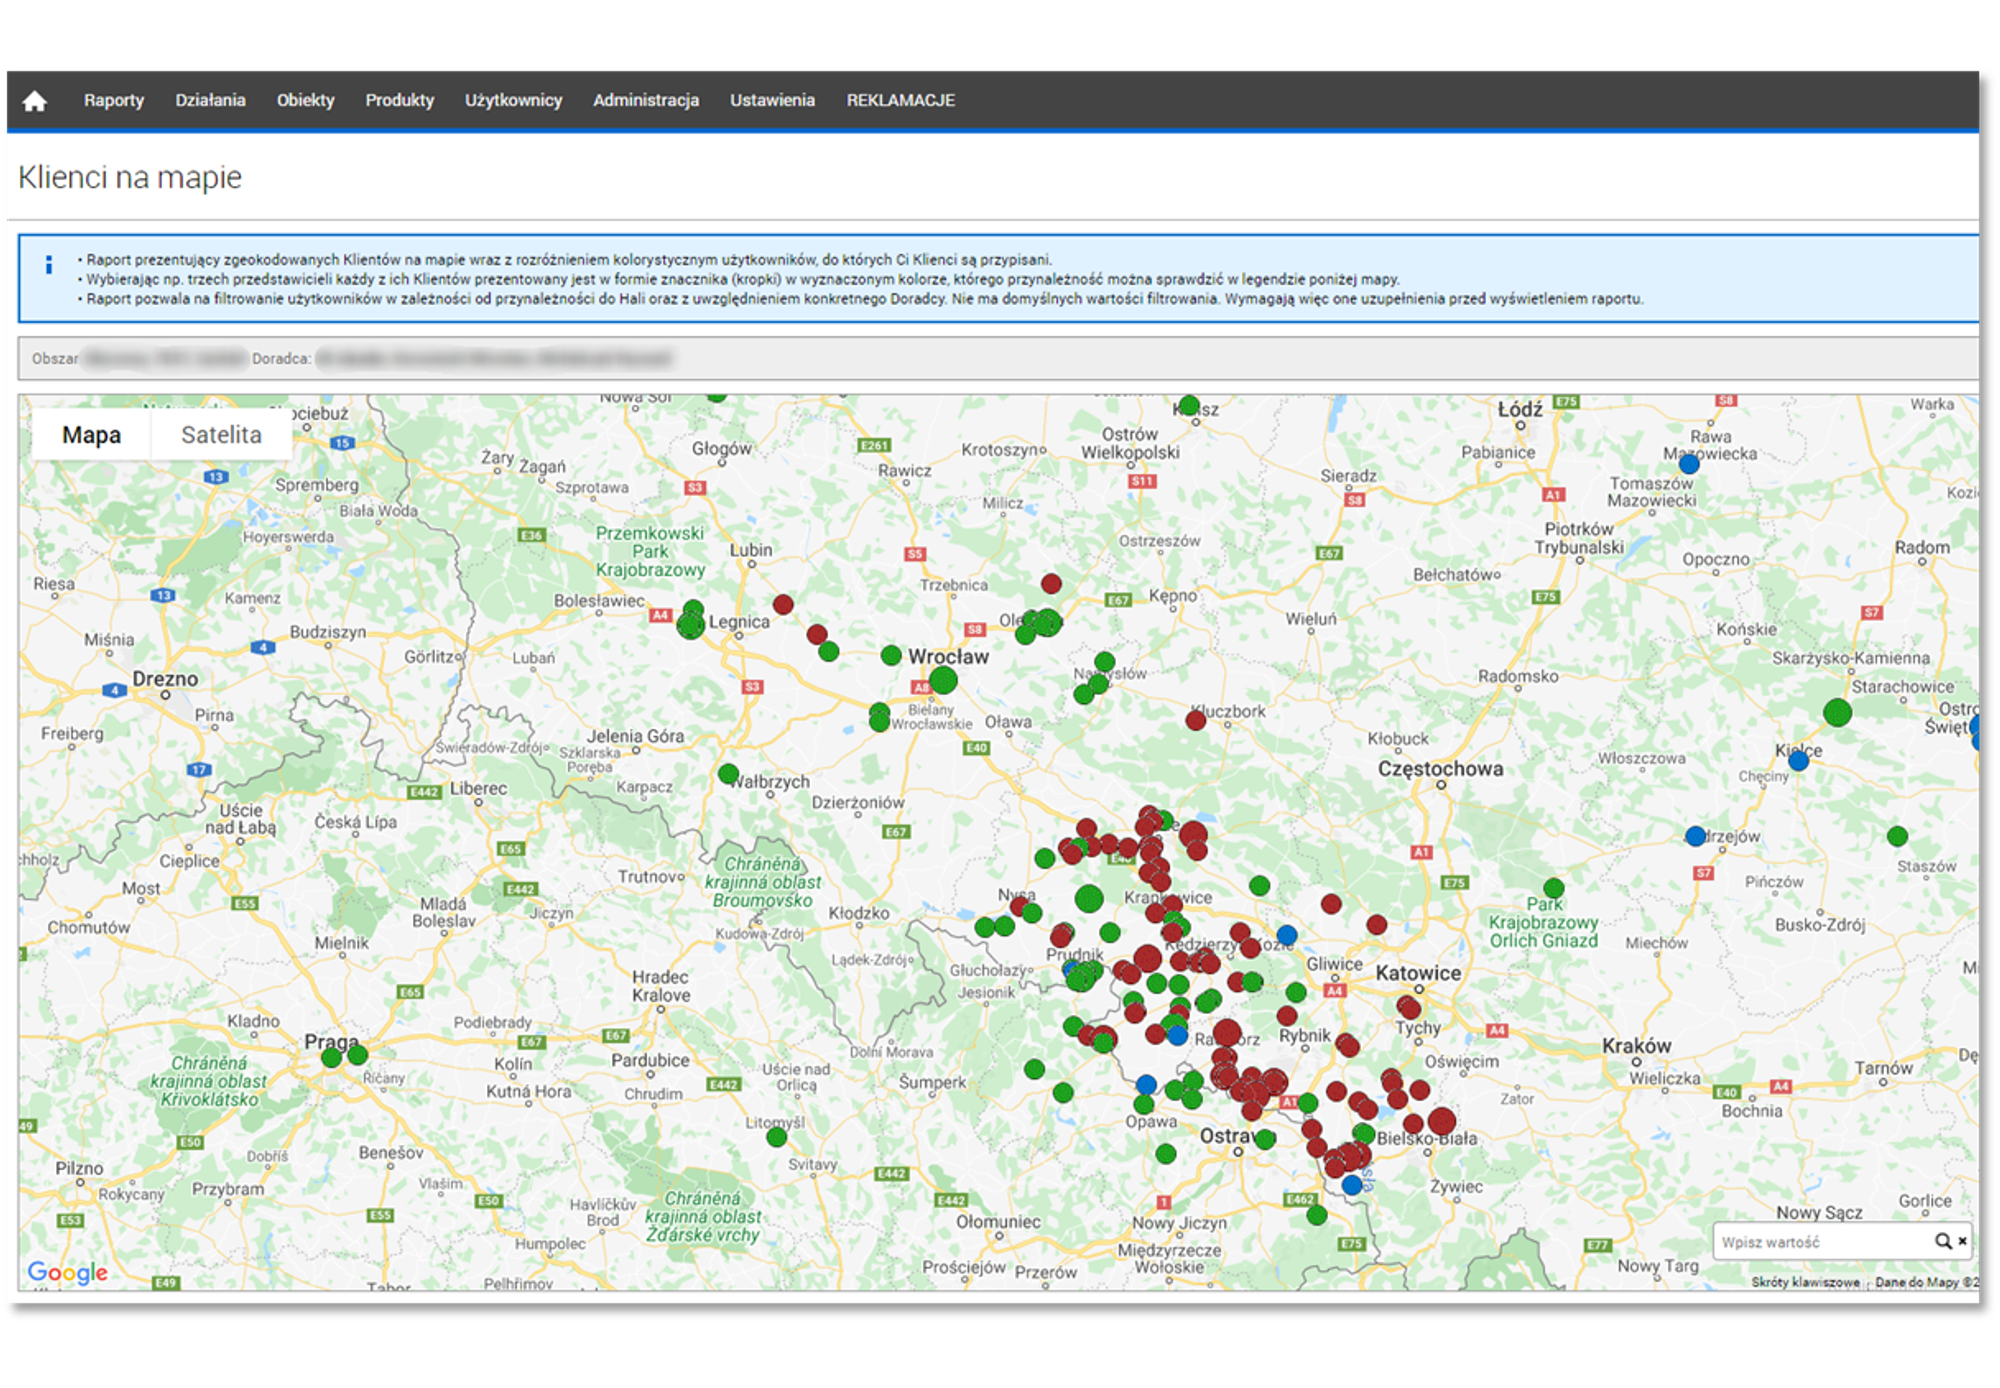
To check assignments to sales representatives, you just need to “color” the sales points on the map with this parameter. The correctness of assigning points to sales representatives (distributors, sub-wholesalers, service technicians, etc.) should be visualized by a series of uniform spots with rounded borders. Naturally, reality is never ideal, and specific decisions about assigning sales points may change model assumptions. For example, you have an employee on your team with a special competency who should serve a specific type of store regardless of their location. There’s nothing wrong with that, as long as such decisions are made consciously regarding the consequences they may have, e.g., fuel costs or travel times to points.
If the distribution of assignments to sales points on the map raises doubts, you can start analyzing the topic more deeply and (if necessary) change the assignments.
Indicator analysis on maps
Plotting data on maps is a topic as extensive as the imagination and analytical drive of sales directors and sales analysts. However, the strength of such reports lies not in extravagance but in the reliability of the data. Below we provide some of the most commonly used reports using maps.
Sales reports on maps
The primary tool for territorial analyses in sales is the visualization of sales results on maps. Repeated results may prompt changing the boundaries of sales areas or the assignments of sales points to representatives. Maps quickly indicate so-called white spots, areas where the offer does not reach. They also help locate territories with too low sales efficiency, where it is not worth investing the sales representatives’ time. The advantage of maps over tabular reports is the ability to group sales points by location and take cross-actions against criteria such as area or assignment to a representative.
Marketing analyses
If you want to check whether the sales territory is optimally managed, it’s also worth using map reporting. The basis is to answer the fundamental and obvious question: “Do I reach everywhere I should with my offer?”. But analyzing white spots can also help diagnose structural sales problems. In other words, certain recurring phenomena can create patterns and indicate dependencies. Some of them may be visible precisely thanks to the map. More precisely: a factor related to the territory may be the common denominator of these phenomena.
Example:
An FMCG manufacturer is looking for the reason why one product category sells worse than the others. Analyzing tabular reports did not find the weaker sales factor. The common denominator is neither the sales representative, nor the Regional Sales Manager (RSM), nor the retail chain, nor the promotion applied. However, when the data was overlaid on a map, it turned out that poor product sales were caused by a catastrophic result in the western areas of the country. By adding data on competitor activity (obtained from merchandising audits) to the map, the cause was identified. It turned out that a company from across the western border decided to introduce a product offer in this category to neighboring regions of the eastern neighbor, i.e., to a part of its sales territory. The price promotions applied by the competitor caused customer loyalty to shift to the new brand. In this example (of course fictional), sales reports on maps inspired a deeper search for causes in a specific slice of the territory.
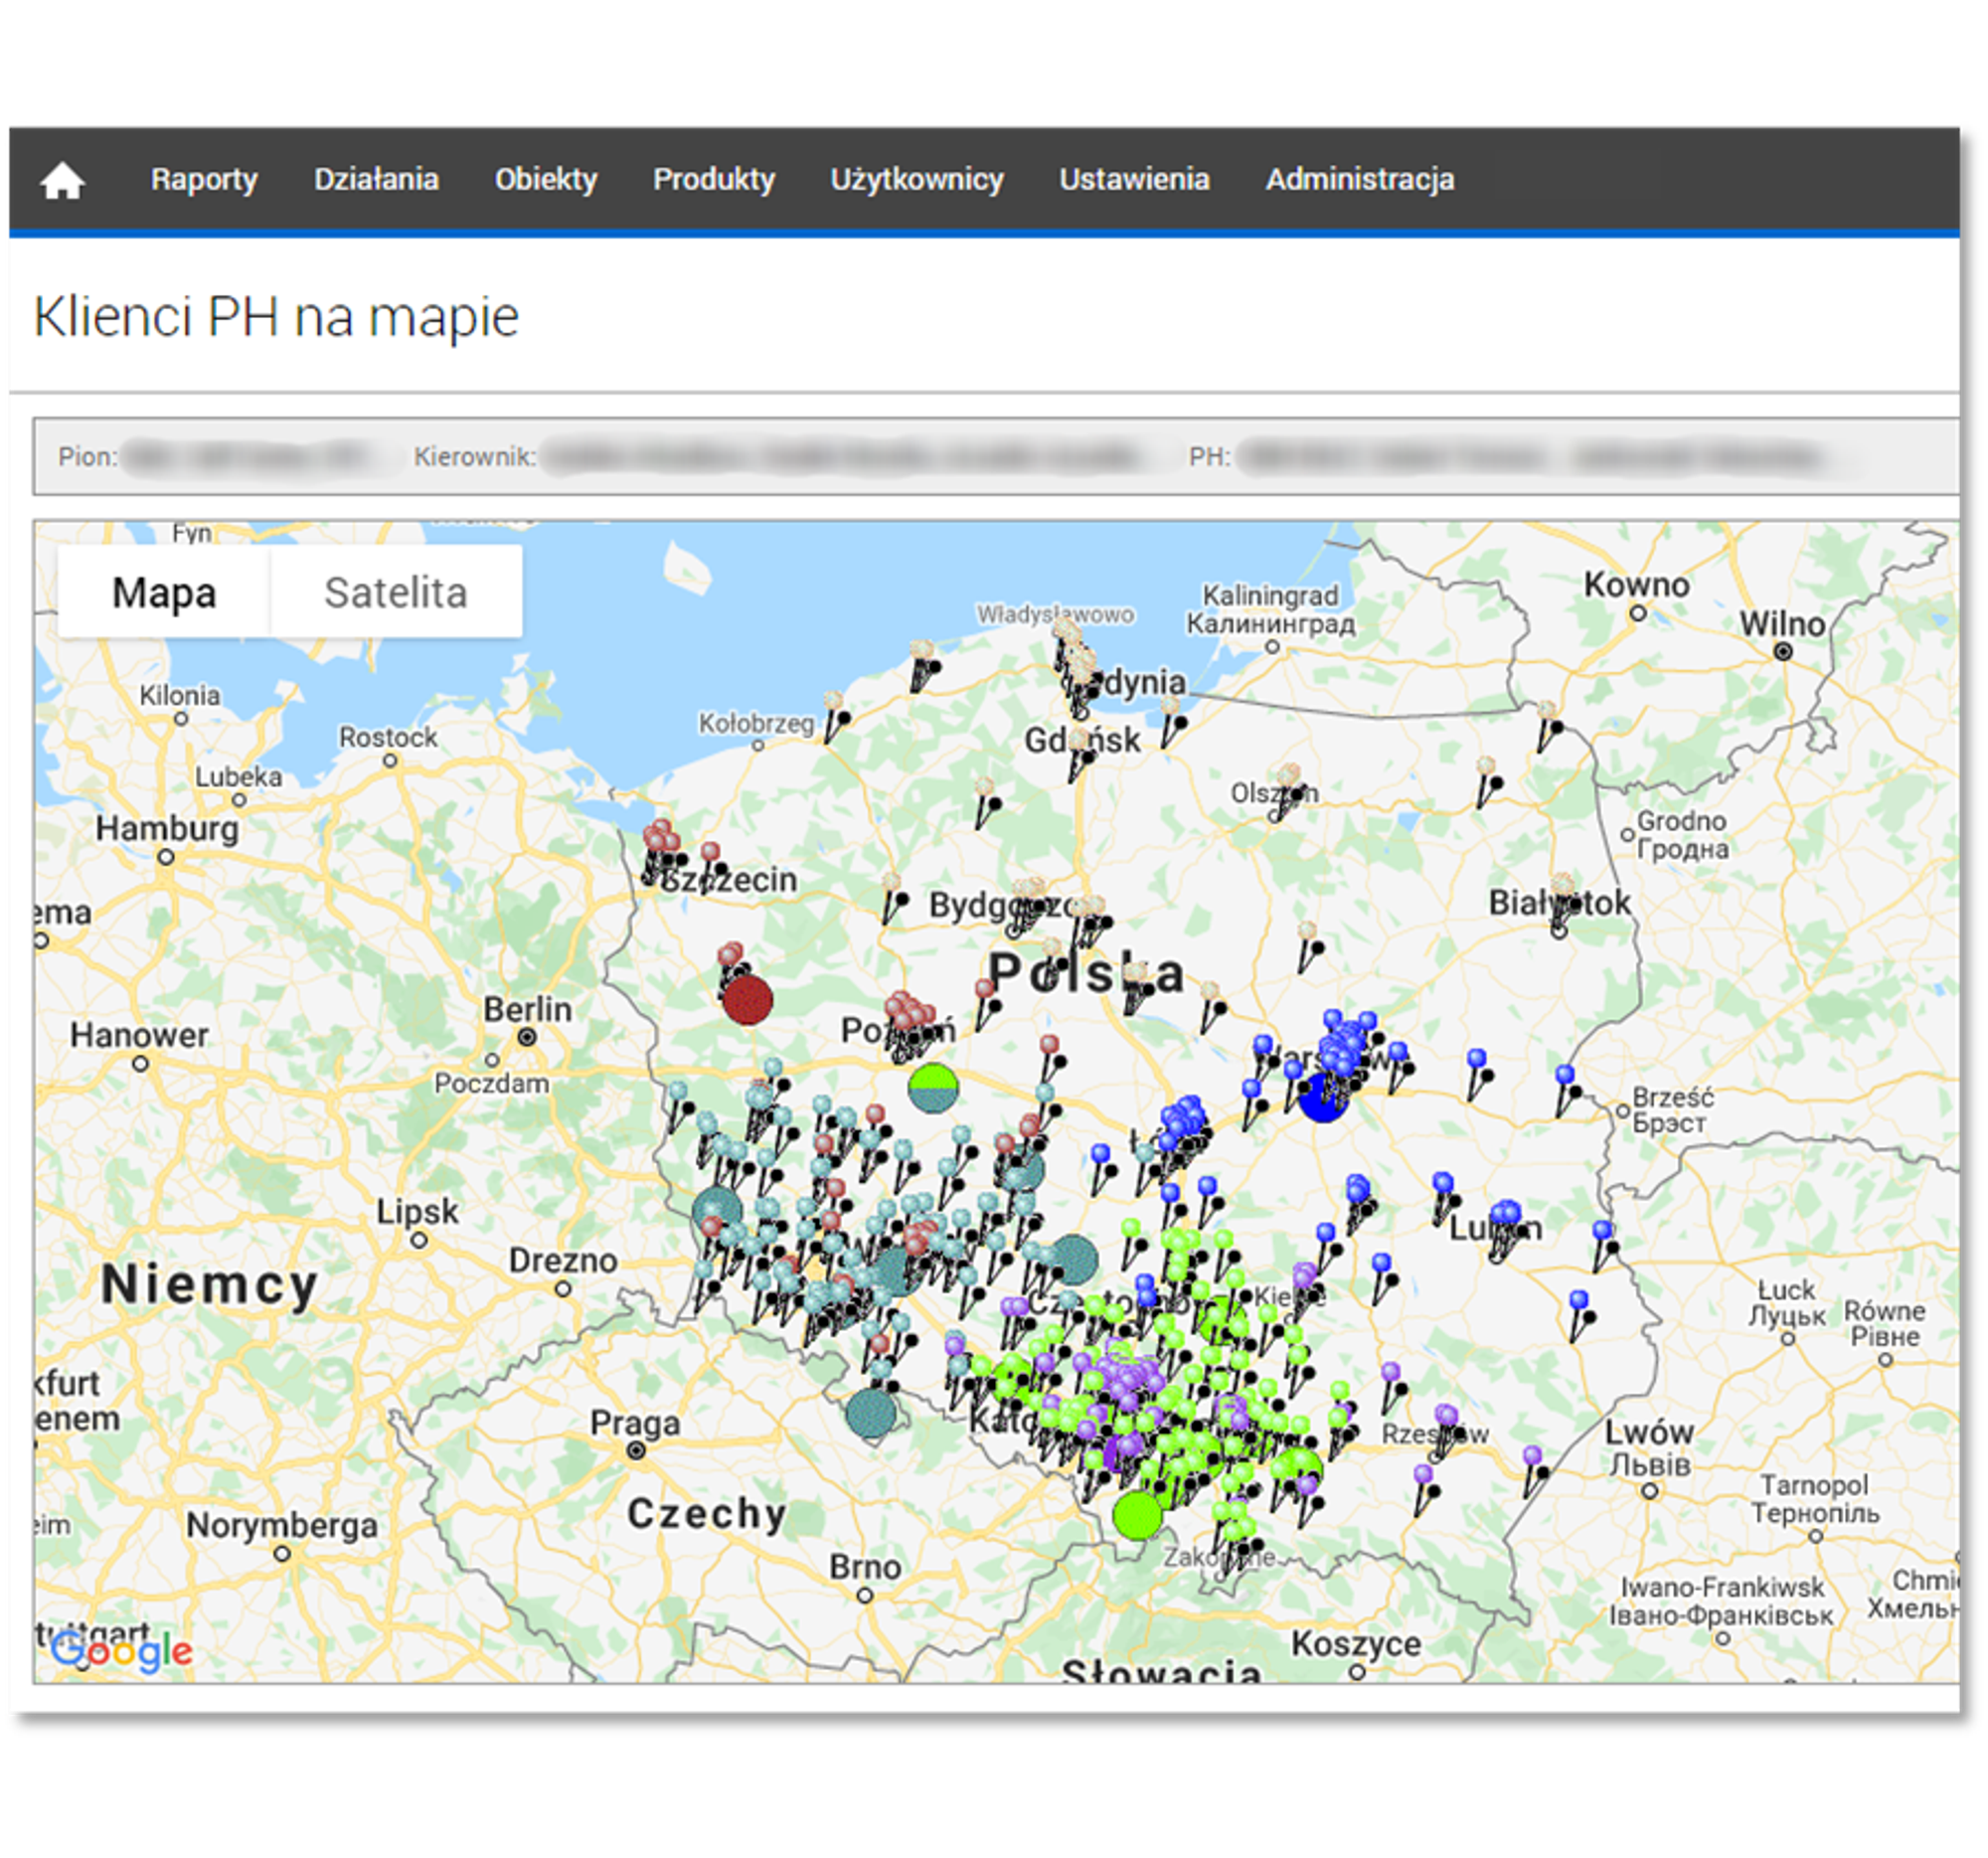
The report above shows a map with the latest known locations of employees in the region for the current day in the eLeader Mobile Visit system.
Sales reports on maps for distribution analysis
Another interesting sales report on a map is the distributor coverage report. Analyzing order history and the structure of distributor integrations may reveal that the list of cooperating companies does not entirely cover the sales territory, or some sales points order from multiple distributors. The latter, of course, is not bad in itself but can cause excessive price pressure and undermine discount policies. Based on geographic analysis, you can contract missing distributors or manage the order stream to optimize their logistics, especially delivery time.
Analyses using external data sources
Displaying indicators on the map can tell us which area requires special actions. More specifically, which Regional Sales Manager should be advised to introduce promotions or provide additional training to representatives. Reports are especially useful where we deal with indicators beyond our control. Such factors cannot be compared to the structure of sales forces or sales territory (examples here include the competitor’s actions mentioned above, demographic specifics, local phenomena, or mass events). Specialized GIS (Geographic Information System) systems are used to collect and manage layers of geographic data.
Additional ideas for sales reports using maps include displaying objects on the map that meet a given criterion. It can be the number of orders per month, Perfect Store index, contractors ordering in the last 2 weeks, ordering from a specific distributor, having new products on the shelf, etc.
Reports related to field representatives’ activity
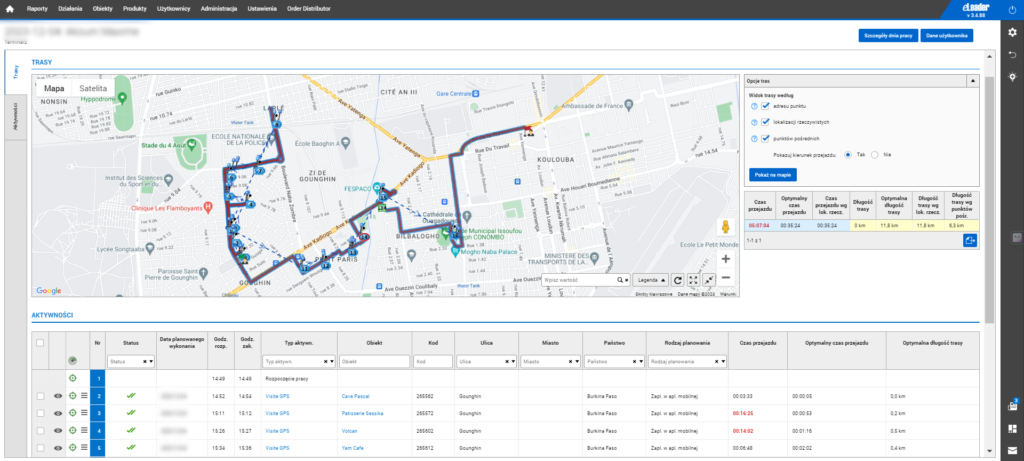
An SFA system should be able to record an employee’s activity and link it to the location. Among the control functionalities of applications for representatives, map views help to understand whether the work is being done in the designated location, how the routes look, how the actual routes differ from the optimal ones, and finally, whether the places of longer stops correspond to the visit plan. Visualizations on maps help to find action patterns and more effectively eliminate irregularities.
Interesting information on the performance and optimization of the sales network will be provided by a report based on the sales representatives’ working time. The key here is working time. Reported over the set norm in the area managed by the Regional Sales Manager or subordinate to one sales representative may indicate an overly ambitious work plan. Among the reasons for the extended working time may be difficulties in working with clients, too long travel time between visits, or an overly dense visit scenario. This poses a threat to the implementation of the sales strategy and requires intervention, e.g., changing the assignments of sales representatives or giving up some tasks in the field. The opposite situation, i.e., a short reported working time (e.g., after implementing tools automating merchandising audits), may indicate inefficient use of resources. This opens up the possibility of expanding the sales network with new points or distributing new tasks (e.g., surveys or promotions). Maps will help change the assignments to sales representatives to maintain the consistency of the territories of other sales representatives.
Analyses related to sales planning
The aforementioned demographic criteria help in planning the reach to stores by sales representatives. The second valuable area is planning the location of sales points by retail chains. It is worth mentioning that users of Sales Force Automation or Field Force Management applications, Network Development Managers, or Location Analysts take as a starting point the characteristics of the population residing in a given territory (residents, students, patients, employees, etc.) to estimate the chances of business success. Besides, maps help to familiarize oneself with the infrastructure, terrain, and communication routes surrounding the future location to eliminate obstacles such as the lack of pedestrian crossings, watercourses, bothersome industrial plants, etc.
Next steps after analyses on maps…
The above examples are just a glimpse of the analytical possibilities provided by sales reports on maps. Analyses are always conducted for a purpose, so they should end with a decision to take action (in a dynamically changing reality, situations where no action is needed are rare). Below we provide an overview of typical conclusions and actions that sales reports on maps will help to undertake:
- basis for segmenting objects – qualifying a store for a segment such as an area is easier when you can check on the map whether the territory’s consistency is maintained,
- changes in assignments – a geographic report can help decide which representative to assign a given object to and how to change such an assignment if there are changes in the team,
- changes in area boundaries – in case of changes in the sales territory or a report of incorrect efficiency of individual representatives, geographic analyses will help correct the boundaries of territories to optimize sales results,
- product offer decisions – withdrawing products, introducing new ones, launching promotions can be carried out in a geographic context, e.g., for stores in a given voivodeship, regional offer, etc.
On a similar principle, decisions can be made regarding sales visit scenarios, about visits or their absence, about collecting additional data, or cooperating with distributors. The map can provide additional information when deciding on recruitment, training, changing targets, KPIs, or display standards. Geography can support decisions about territory-oriented marketing actions or the language of communication with the target group.
Niche knowledge straight to your inbox!
If you find what you’re reading interesting, sign up for our newsletter to receive valuable articles straight to your email inbox.

Leave e-mail here:
Read also:

Kontrola pracy przedstawicieli handlowych
Wizyty handlowe, merchandising stacjonarny, wizyty serwisowe, promocje, animacje to działania, które budują relacje z klientami, zwiększają strumień zamówi...